The crypto asset market is getting more and more intense, especially the price of BTC which is getting “scary but delicious”. A number of analysts have given their reviews, including saying that market players are wary of the zone support level US$51 thousand.
BTC Price Could Drop to US$40,600
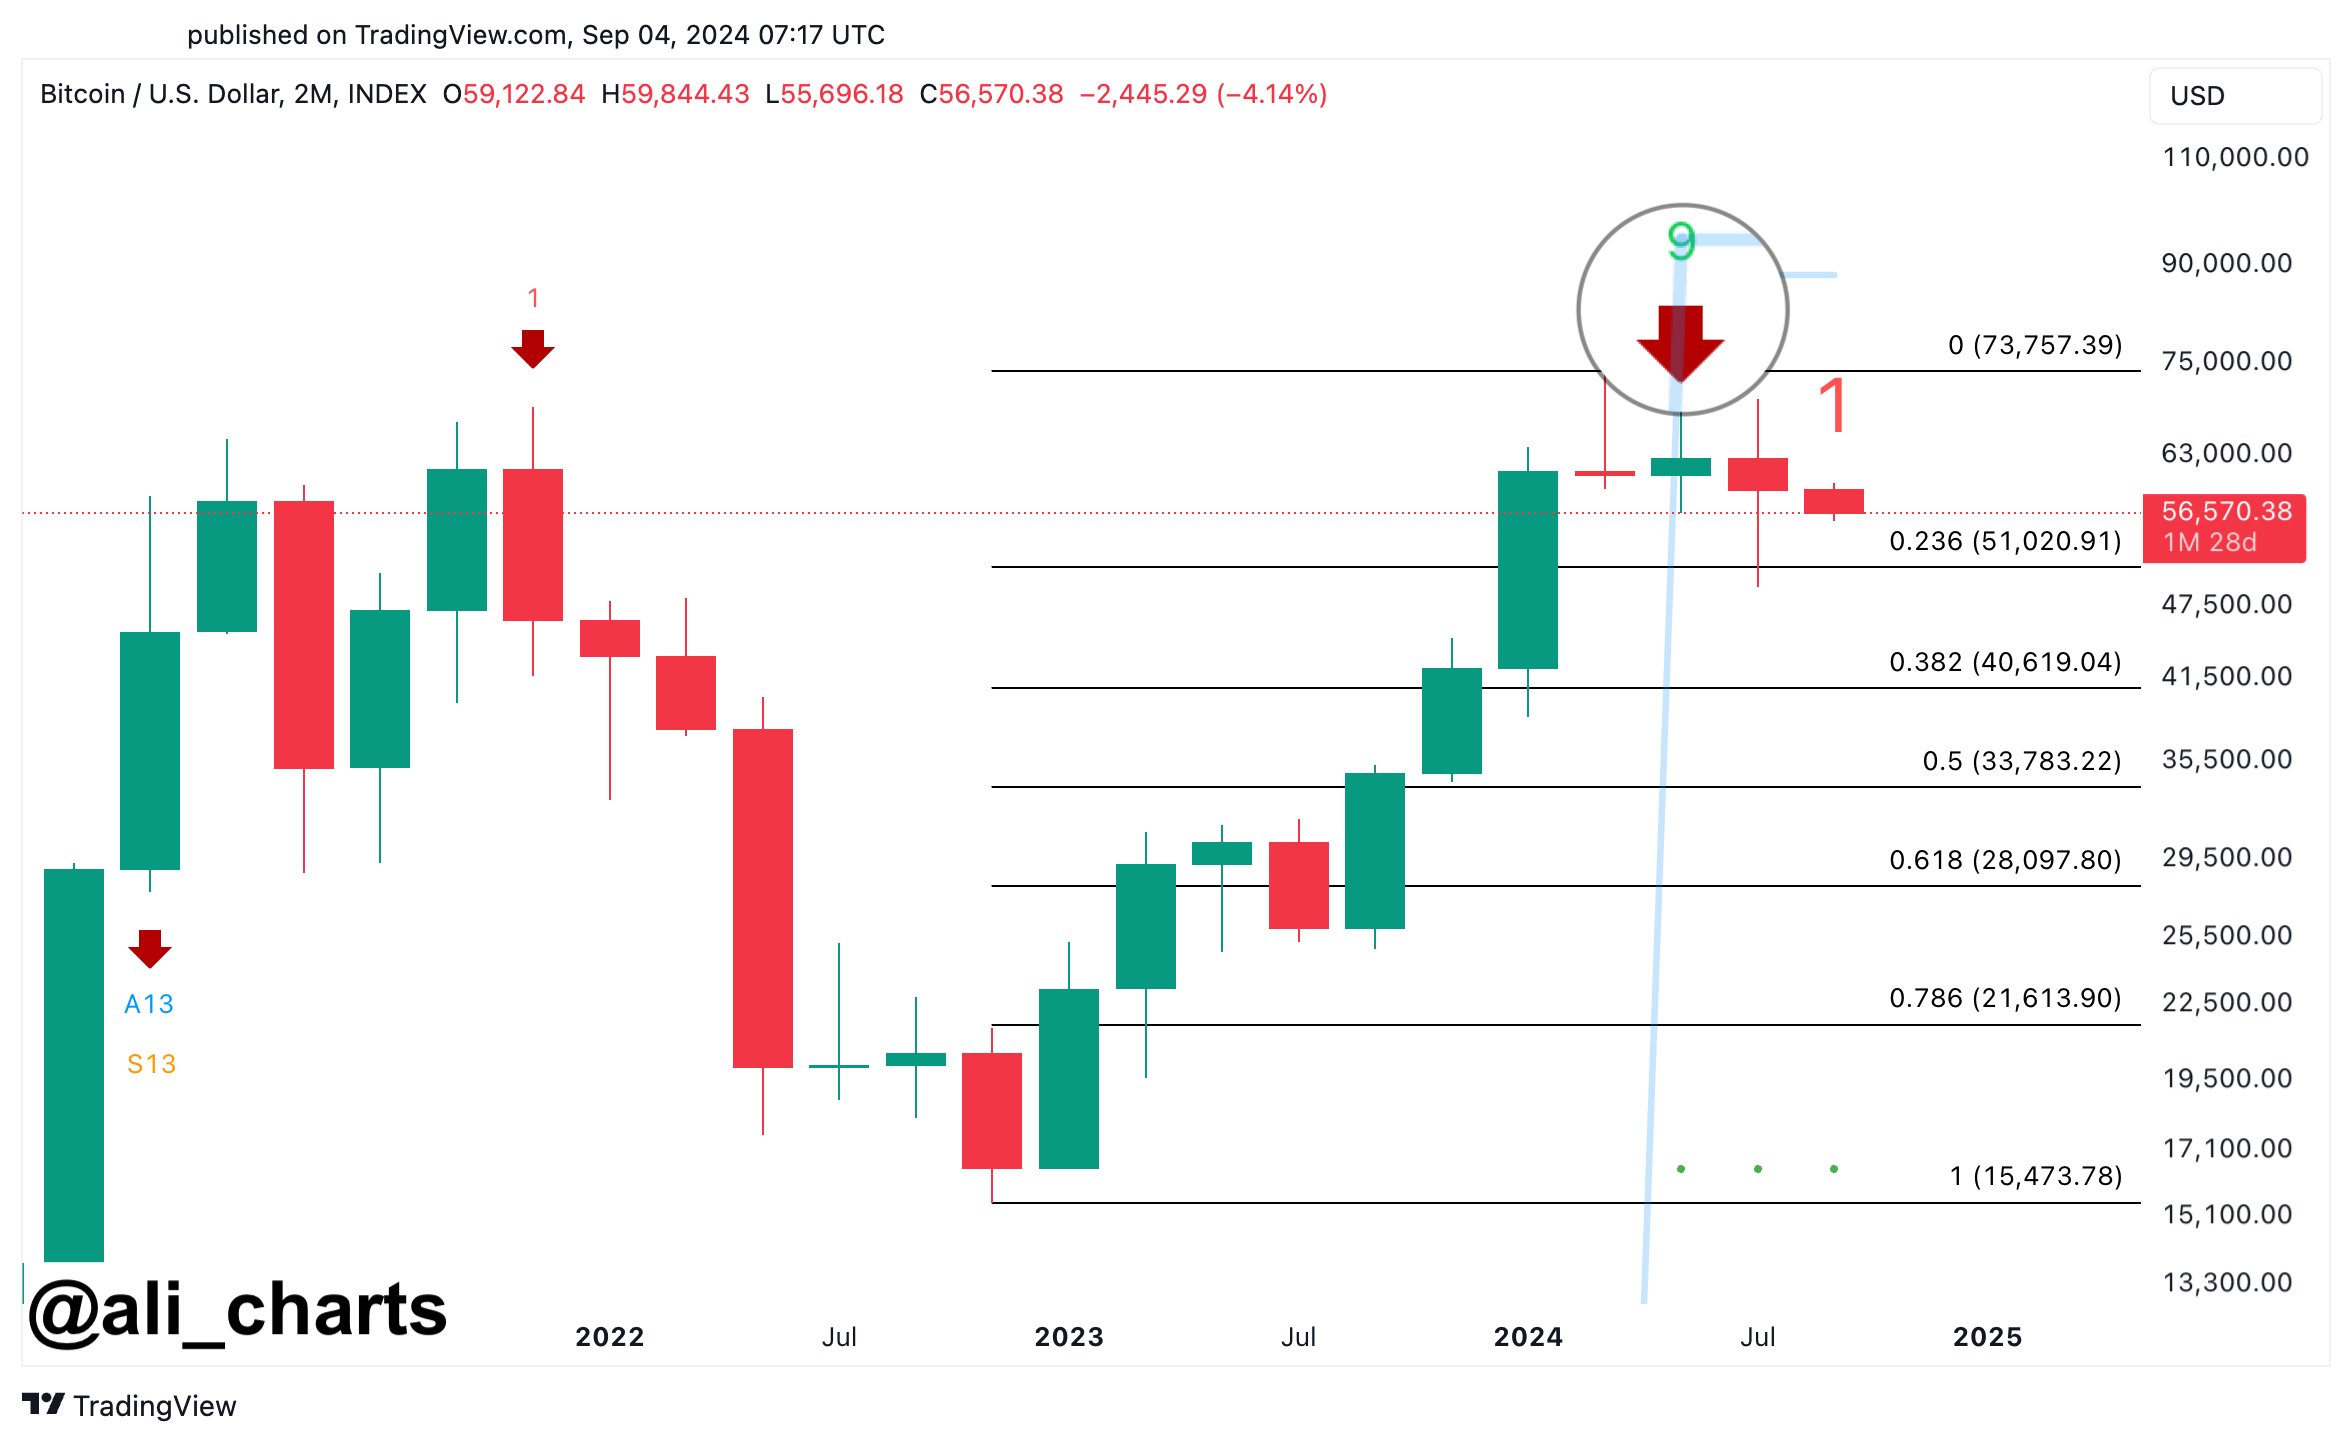
It was Ali Martinez, a popular crypto analyst at X, who said that there was a further sell signal anticipating the next correction, where the BTC price could drop to US$40,600.
“On the 2-month Bitcoin chart, the TD Sequential indicator is showing a sell signal anticipating a correction. If support level at US$51,000 is broken below, then BTC could drop to US$40,600!” he wrote on Wednesday, September 4, 2024.

On the same day, in the morning, the price of the number one cryptocurrency fell to US$55,613. By midnight, BTC was up slightly at US$58,386.
The TD Sequential indicator suggests that Bitcoin may be due for a correction after the recent sell signal. If support level at $51,000 split, there is a possibility of a drop to around $40,600. This would mark a significant drop, so keep an eye on it levels This key is very important for the trader.
The TD Sequential indicator is a technical analysis tool designed to identify potential trend reversals and momentum exhaustion in price movements. It works by calculating a series of bar or price candleusually up to 9 or 13, to indicate when the trend may be nearing an end.
If a series of series completes, it indicates that the current trend may have gone too far and a reversal or correction could occur. trader often use TD Sequential to identify buy or sell opportunities by analyzing when price action has reached potential inflection points.
The TD Sequential indicator can be compared to a countdown timer in a race. Just as a race begins to wind down as it nears the finish line, the TD Sequential counts down the strength of a trend, signaling when it might change direction. When the countdown is complete, it indicates that the market may have run out of steam and is ready for a reversal or correction in the context of BTC price.
Stochastic RSI Signal, Trend Reversal To Bearish
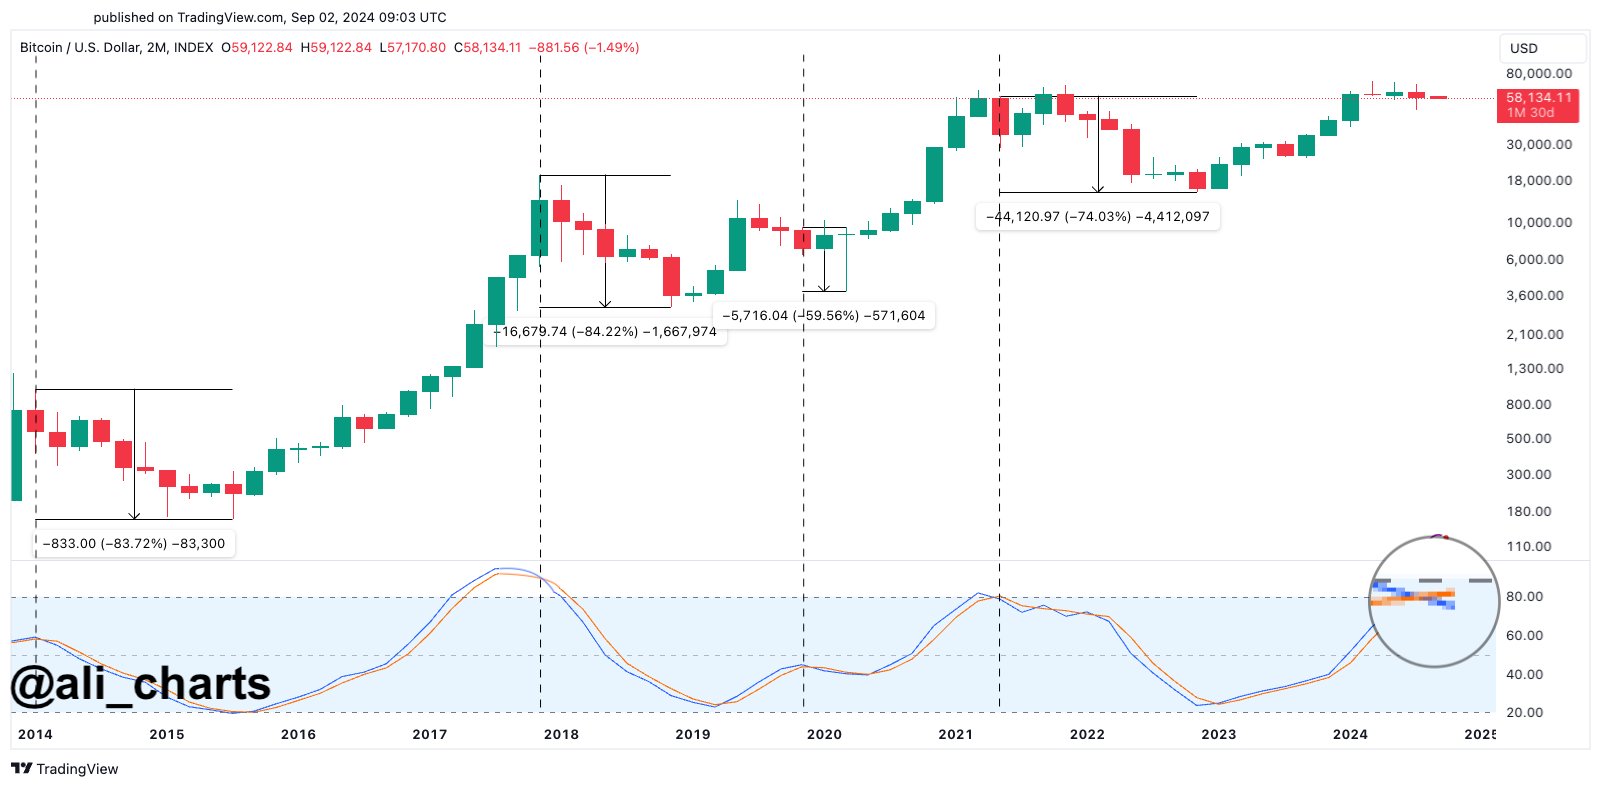
In a separate post, Martinez also noted the price of BTC on a chart with time frame the same, namely 2 months, but using data from Stochastic RSI.
“Key observation on Bitcoin’s 2-month chart. Stochastic RSI has just signaled a trend reversal from bullish to bearish. Historically, in the last 10 years, this has often preceded a significant correction with a probability of about 75.50 percent!” he wrote.

Stochastic RSIan oscillator that measures momentum, has signaled a trend reversal from bullish to bearish. This indicator compares Bitcoin's closing price with its price range over a specified period and is very sensitive in identifying conditions. overbought or oversold. When the Stochastic RSI shows a reversal, it indicates that the momentum driving the price up has weakened, and a downtrend may be about to begin.
Historically, over the last 10 years, the reversal bearish similar on the 2-month chart often precedes a significant correction. This pattern is similar to a car going from accelerating forward to suddenly braking—momentum changes direction, causing a sharp slowdown or reversal in the car's movement.
Likewise, when the Stochastic RSI indicates a reversal bearishit is like a warning that Bitcoin price may face a sharp decline. trader often use this indicator to anticipate major price movements and adjust their strategies accordingly, preparing for potential corrections.
Alex Thorn: September Could Be the Worst Month for Bitcoin
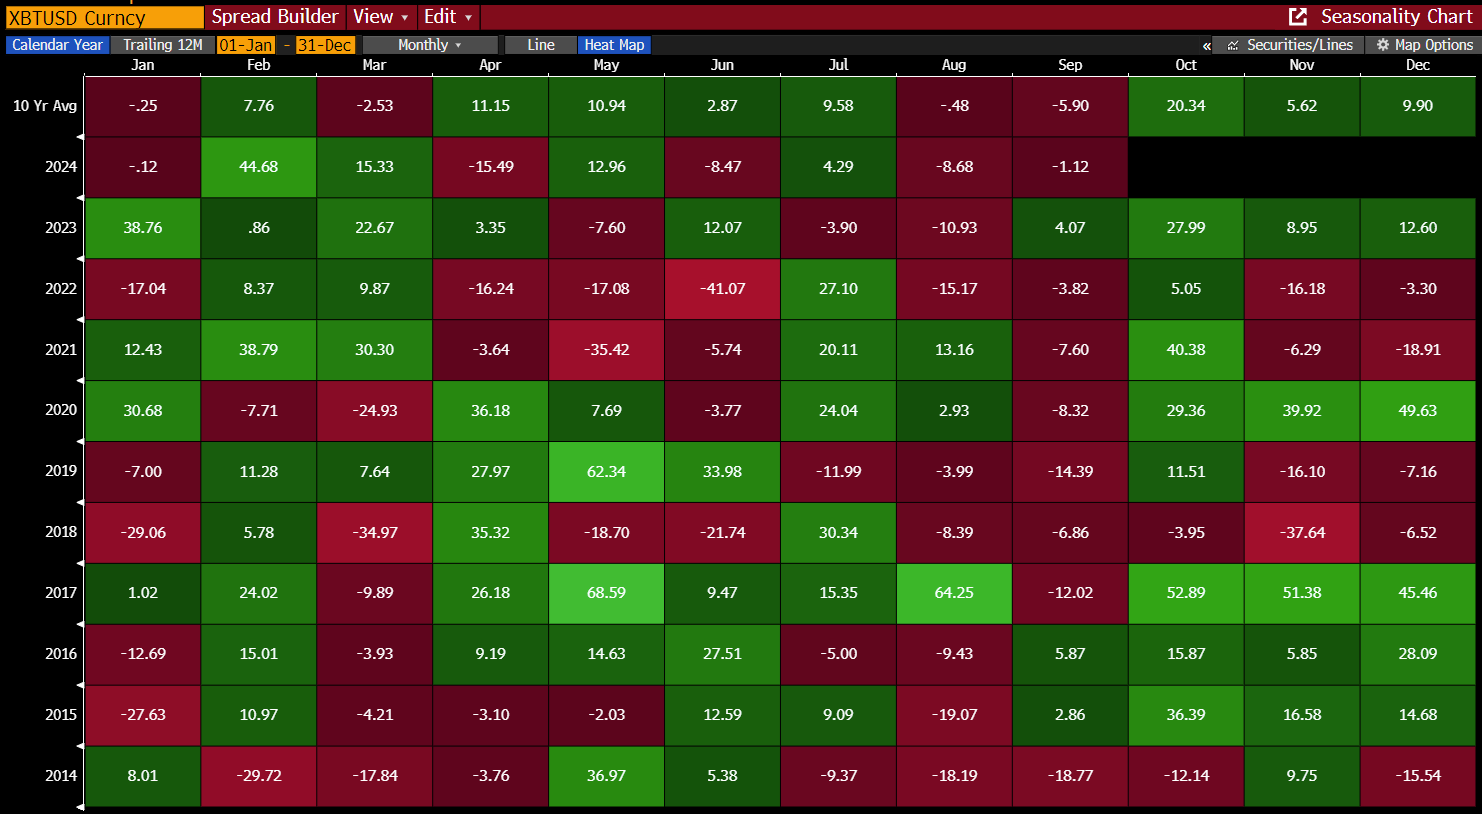
Meanwhile, the latest BTC price study also comes from Alex Thorn. He argued September 2024 This could be another bad month for Bitcoin and October could be brighter. He bases his argument on historical data.
“From a historical perspective, September has historically been the worst performing month for Bitcoin. In 7 of the last 10 Septembers, BTC has been down. However, October was the best month for Bitcoin, and the rest of the fall is usually bright,” write Alex at X.

The repeated declines could be due to a variety of market factors, such as profit-taking after the summer rally or a change in investor behavior as the year draws to a close. September’s poor performance could be seen as the market cooling down before gearing up for the final quarter.
In contrast, October has historically been Bitcoin’s best month, often marking the start of a stronger uptrend. This change can be attributed to renewed optimism as investors anticipate a year-end rally and potential new highs. The rest of the fall typically follows this positive momentum, with November and December also showing strong performances in many previous years.
QCP Capital: BTC and ETH Volatility Increasing
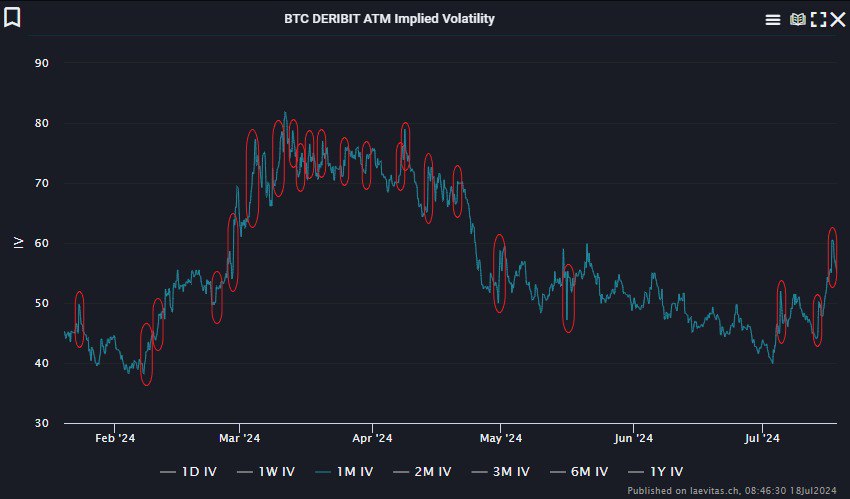
The latest analysis from QCP Capital reveals that BTC and ETH price volatility is increasing, but shows no signs of a downtrend or uptrend.
“The Volatility Momentum Indicator (VMI) from QCP has given a new signal for BTC and ETH. It shows that the market is entering a period of increased volatility. This signal is not directional, meaning it does not indicate the direction of the market spotbut larger price movements are likely in the near future,” call they.

This also means that a larger price movement is expected, although the direction of this movement—up or down—is still uncertain. This makes it an important tool for traders. trader who anticipate volatility but are unsure about the direction of BTC and ETH prices. [ps]


