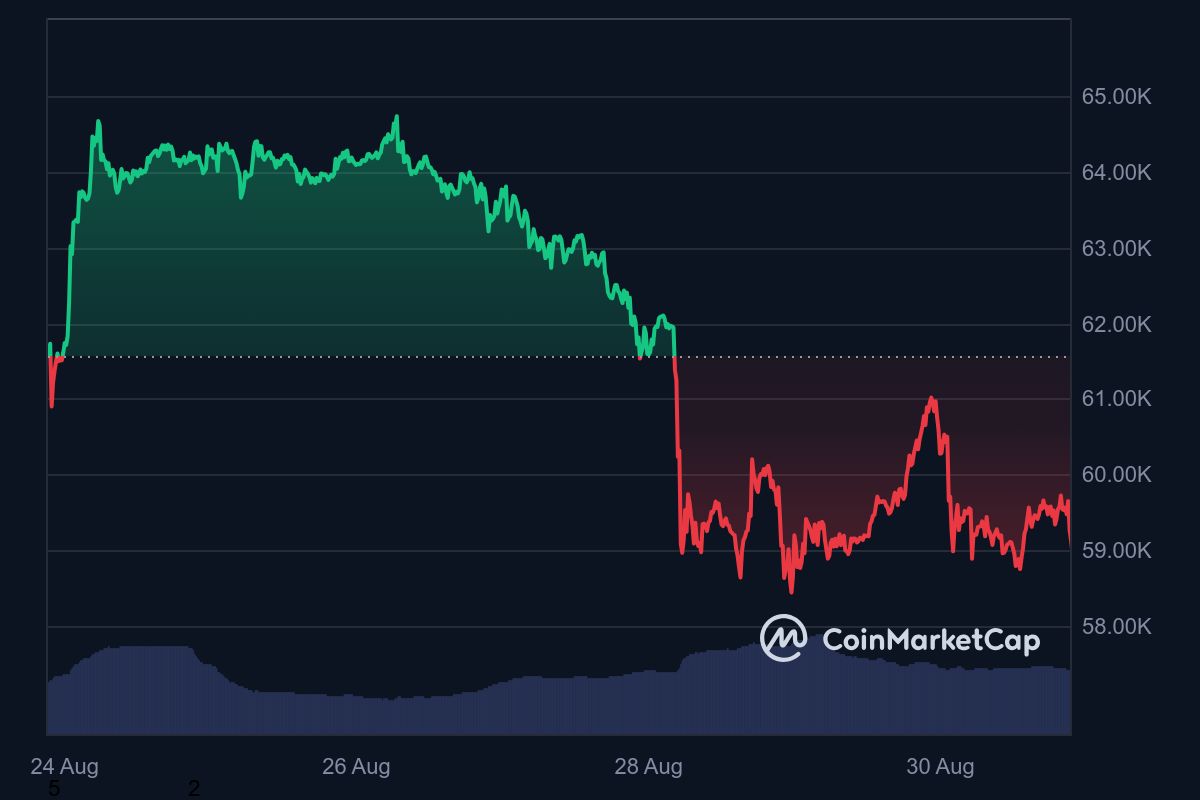
A number of experts interpret the existence of a BTC buy signal based on a number of recent data, the impact of the dynamics of the crypto asset market which is currently weak.
When this article was written on Friday night, the price of BTC was around US$59 thousand, bouncing 2.34 percent in the last 24 hours and 4.5 percent in a week, after a major correction since August 28, 2024 from US$61,900.
However, a number of experts interpreted the existence of a BTC buy signal based on some of the most recent data, when the market value of crypto assets moved down in the range of US$2.09 trillion.
BTC Buy Signal, Big Players Swoop in When It's Cheap
The first image comes from Ali Martinez who interpret data on-chain BTC from Santiment. It is stated that there are more and more BTC withdrawals from a number of crypto exchange large, which indicates that selling enthusiasm has the potential to become smaller.
“It seems like a number of big players are buying Bitcoin at a low price like now. Based on the data on-chain from Santiment as much as 40 thousand BTC came out of crypto exchange in the last 48 hours. This is equivalent to US$2.40 billion,” he said at X, Friday, August 30, 2024.
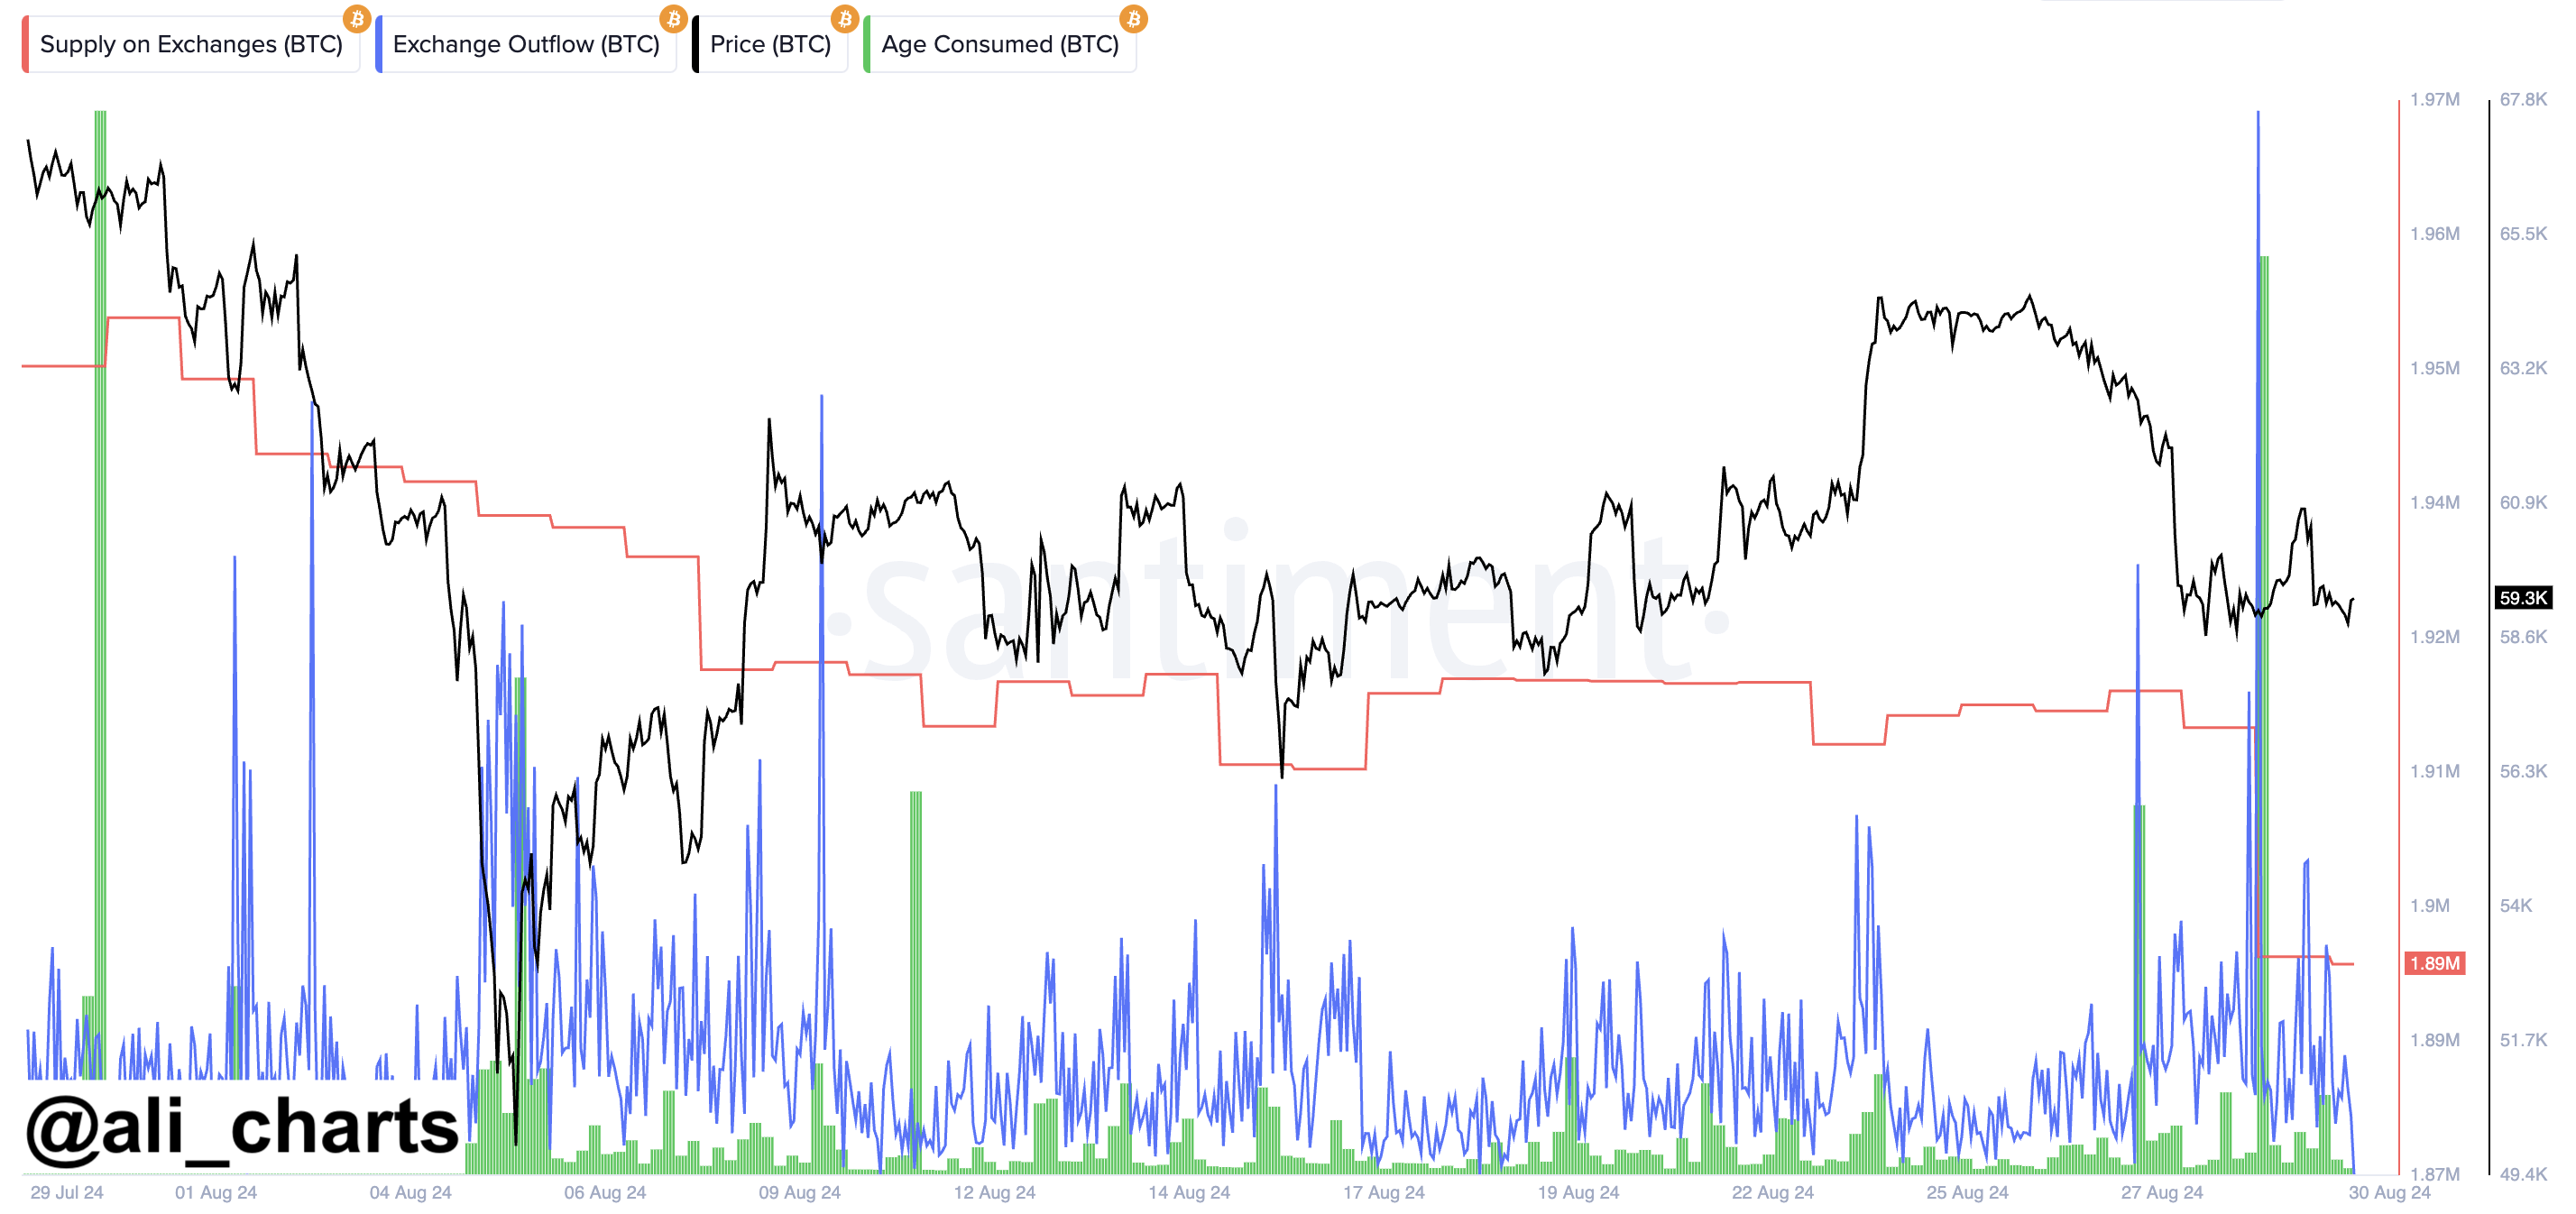
Martinez's opinion suggests that a large amount of Bitcoin has been moved off exchanges, which usually means that large investors or institutions are buying large amounts of Bitcoin and storing them off exchanges. However, there is another possibility, namely trader want to do arbitration to book a profit.
In addition, this surge in outflows often indicates that large investors or institutions have no intention of selling Bitcoin in the near future and tend to believe that the price of Bitcoin will increase in the future. In other words, this data shows that large players in the market are using the price drop as an opportunity to buy and hold Bitcoin. And for the wider market participants, expert opinion can be considered as the next BTC buy signal.
Bitcoin Hash Price Down, Indication of Buying Opportunity
The same thing came from analyst Woominkyu, based on the relationship between Bitcoin price movements and… Bitcoin Hash Price. He thinks that at this time Bitcoin Hash Price dropped to its lowest record and historically aligned with the BTC price decline, then continued to bull run. He also concluded that this is a signal to buy BTC.
“Recent data shows Bitcoin Hash Price is at a low which often aligns with lower Bitcoin price declines. Historically this is a low buying opportunity,” he said in X.
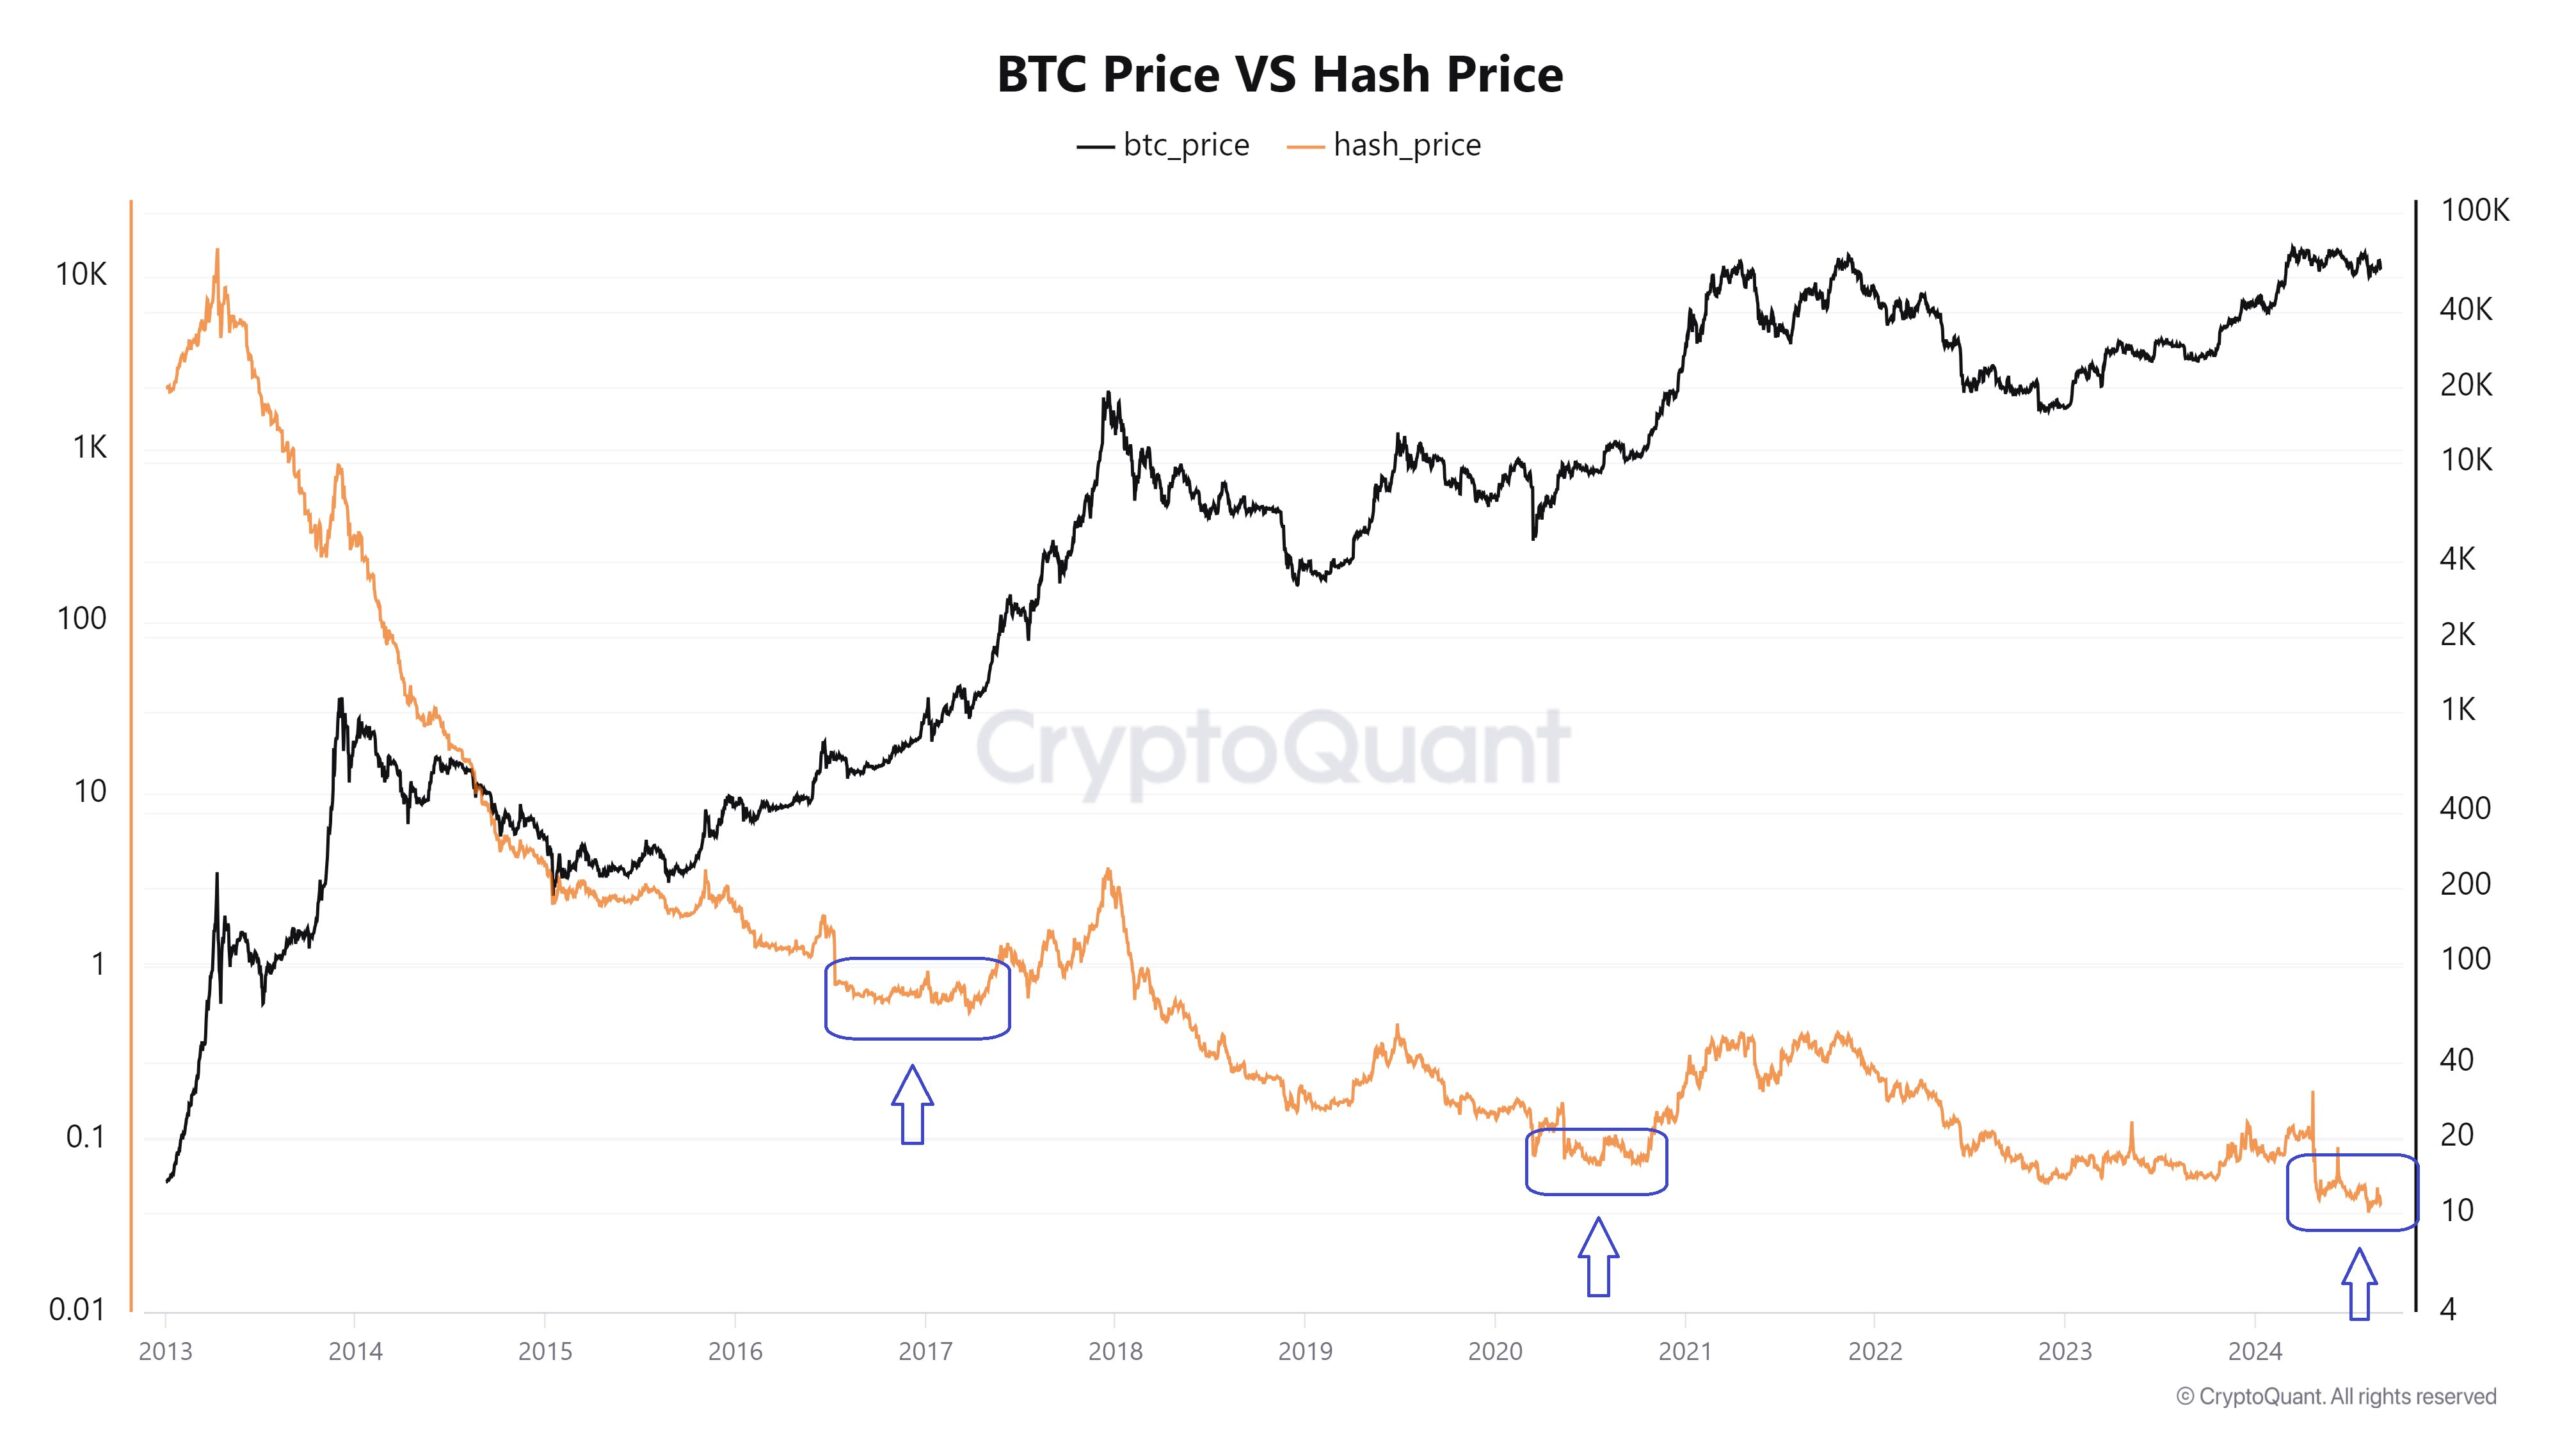
Bitcoin Hash Price is a measure of the costs required to mining bitcoinwhich describes the level of difficulty and operational costs in the mining process. In the context of Bitcoin, Bitcoin Hash Price often refers to the amount paid to acquire a unit hashing powernamely the computing power used to process transactions and settle accounts. block on the Bitcoin blockchain.
When Bitcoin Hash Price high, this means that the cost of mining Bitcoin is relatively expensive, due to the high mining difficulty and fierce competition among miners. On the other hand, when Bitcoin Hash Price low, the cost to mine Bitcoin is decreasing, which could be due to a decrease in the difficulty level or a decrease in operational costs.
US Military Major Suggests Uncle Sam Mine Bitcoin, For What?
Bitcoin Hash Price low often coincides with a decrease in the price of Bitcoin itself, as a decrease in the price of Bitcoin can reduce the profits from mining, which in turn affects the costs and interest of miners. Therefore, Bitcoin Hash Price can be used as a marker to assess whether now is a good time to buy Bitcoin, assuming that the low points in Bitcoin Hash Price often serves as a signal to buy Bitcoin at a lower price.
Bitcoin Retail Investors Can Enter Above US$70K
Another BTC buy signal based on ratio Exchange Inflow/Outflow. This is interpreted by Axel, a popular analyst at X. He focuses on the data that whale BTC is on a buying spree. But he thinks retail players will come in when BTC hits above $70K.
“The average value of the ratio Exchange Inflow/Outflow indicating strong buying. This has happened 6 times in the last 10 years. Retail investors of course have not reacted, they will probably enter when the price is above US$70 thousand,” he wrote.
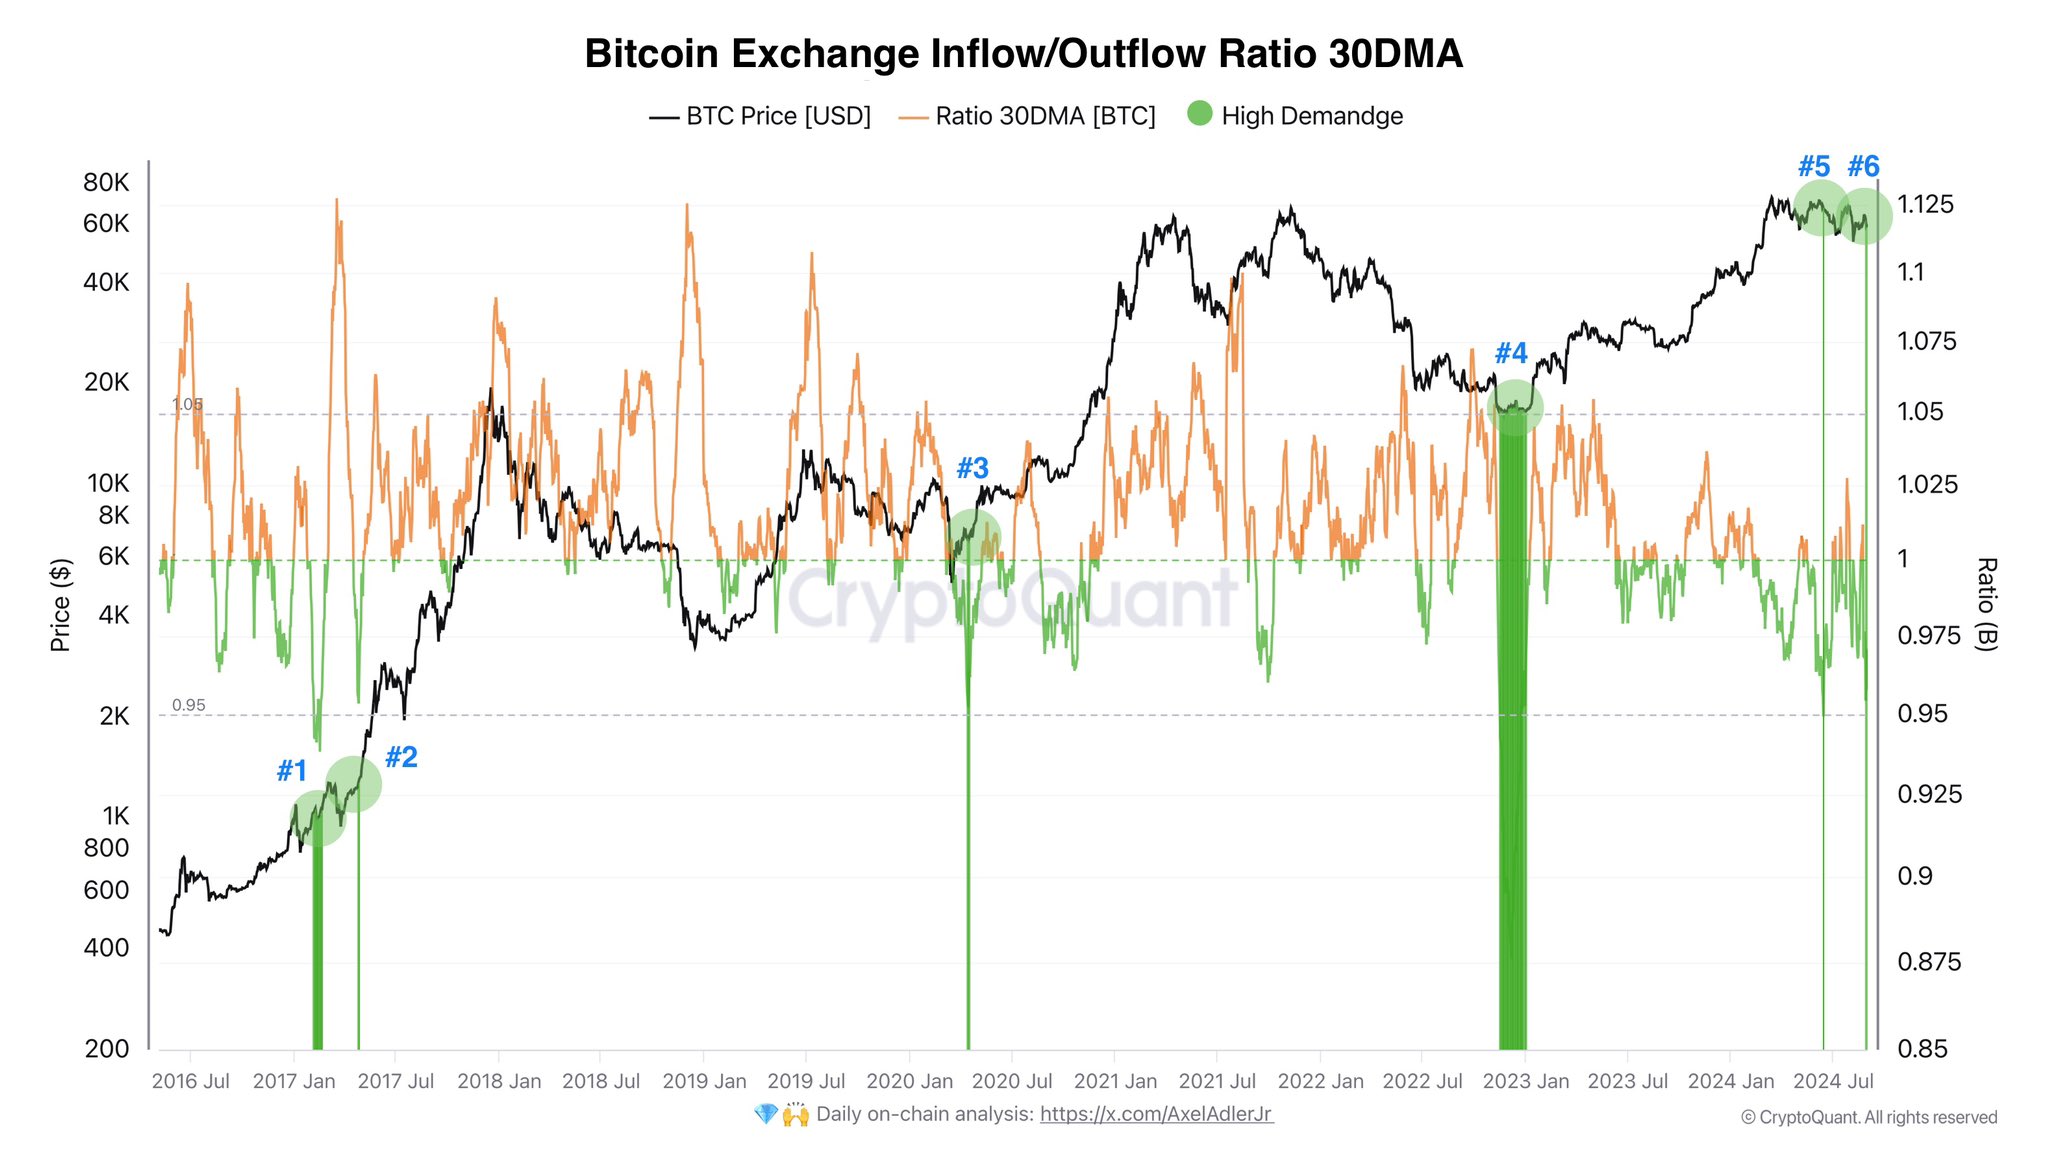
This implies that the average ratio of inflows to outflows from exchanges indicates strong buying pressure in the Bitcoin market. This ratio measures the ratio of the amount of Bitcoin entering an exchange to the amount leaving it. When this ratio shows high buying pressure, it means that there are more Bitcoins leaving exchanges than entering, indicating that investors are more likely to buy and hold Bitcoin than to sell it.
The statement also mentioned that this is the sixth time in the last ten years that this ratio has shown strong buying pressure, indicating that this phenomenon is not uncommon and may be a reliable pattern for market analysis.
That retail investors—who are usually small investors or individuals—are unlikely to respond to this buying pressure until the Bitcoin price reaches level higher, such as US$70,000. This suggests that retail investors often enter the market only after Bitcoin prices have risen significantly, while strong buying pressure may not yet influence their decision to invest at this stage.
Some experts consider the latest data as a signal to buy BTC, despite the price drop. The main indicator is the increase in BTC withdrawals from exchanges and Bitcoin Hash Price low. This signal indicates a BTC buy signal for big players, although retail investors may only enter when the price rises higher.
US$100K Forecast for Bitcoin
Previously, the latest prediction for Bitcoin (BTC) showed a potential increase of up to US$100 thousand based on Elliot Wave analysis. An analyst at Tradingview believe that now is the last chance to buy before the BTC price spikes.
On August 5, 2024, support level at US$49 thousand was reached, which marked the beginning of the “Double Zigzag” pattern. This analysis is based on the Elliot Wave theory, which groups market movements into impulsive and corrective waves.
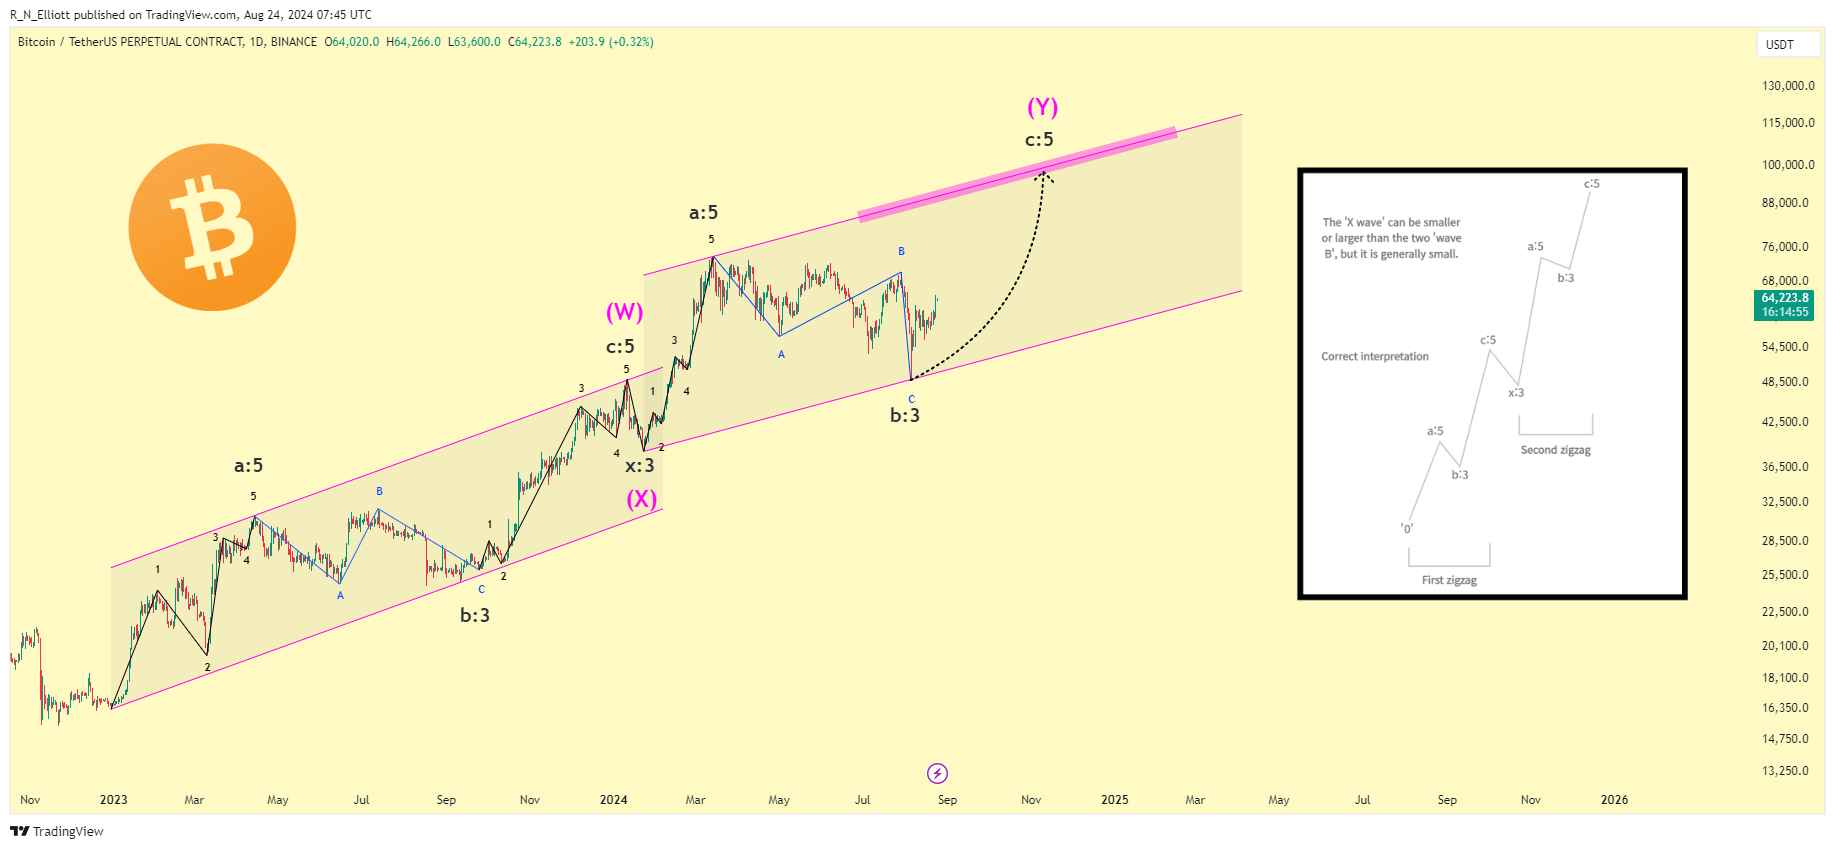
The “Double Zigzag” pattern, which consists of two zigzag in a row, indicating that the correction is complete and the uptrend will continue.
This projection is reinforced by technical indicators such as RSI and MACD, which show momentum. bullish the strong one.
In particular, analyst Dan Gambardello in video his latest directs market participants to pay attention to the 20-week moving average (MA), which he describes as a historically significant marker in differentiating between markets bullish And bearish.
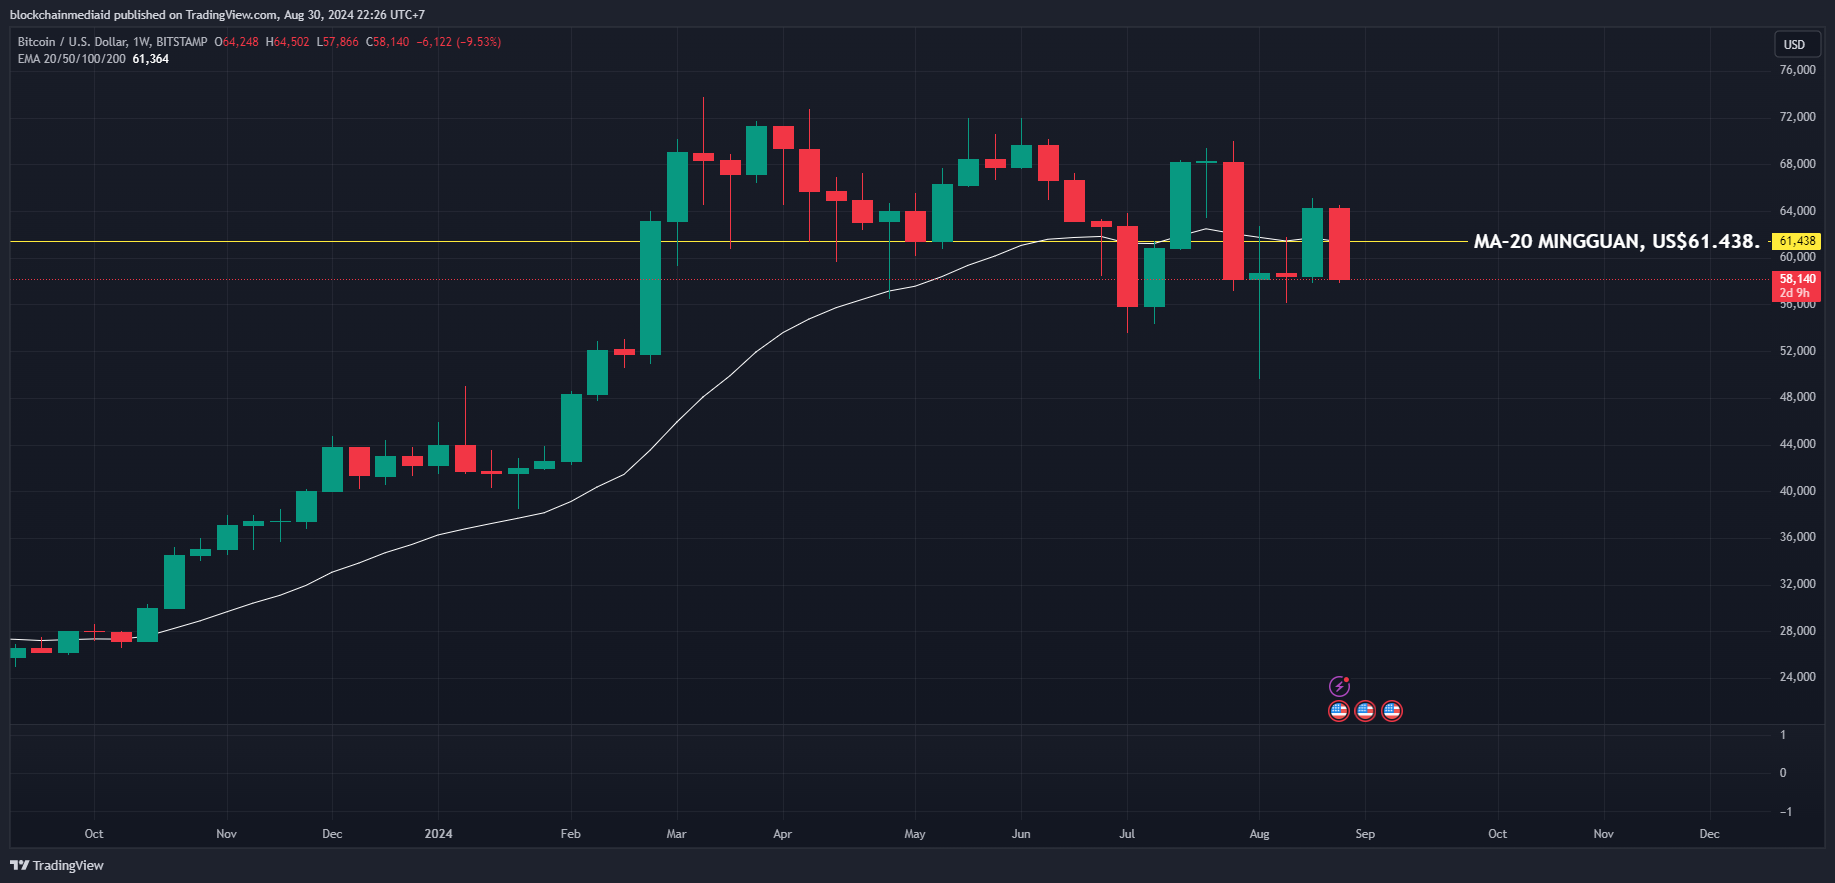
He showed that the failure to maintain level above the moving average it often precedes the trend bearishtemporary support at or above this line may indicate a condition bullish.
“Failure to get above the 20-week moving average is something that happens frequently to Bitcoin when it enters the market. bearish,” he said.
Latest monitoring on the weekly BTC chart, MA-20 is in the range of US$61,543 with the current BTC price below it, at US$58,281. Last BTC was at its lowest below level that, on August 5, 2024, in the range of US$49,861. [ps]


